GeoCloud Automation
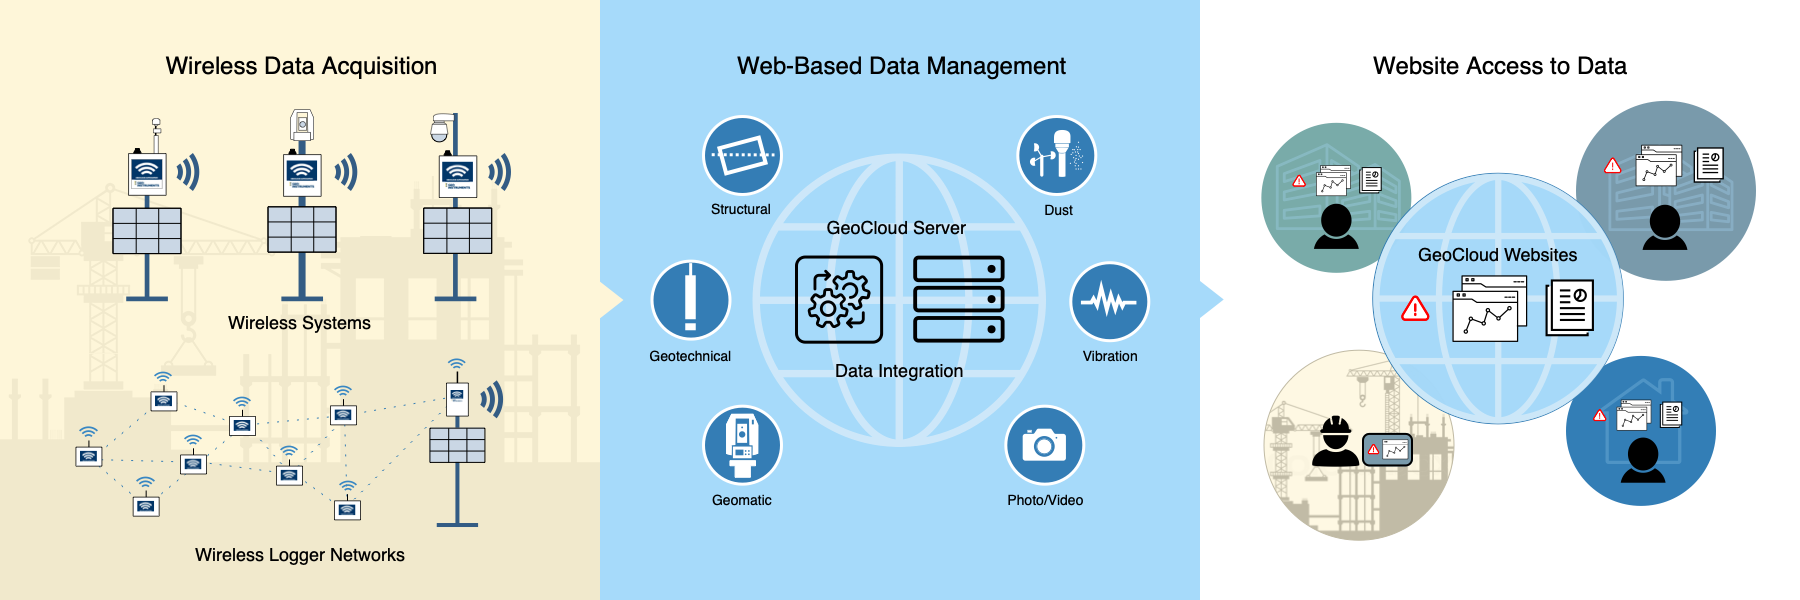
GeoCloud automated monitoring features wireless data acquisition, web-based data management, and website access to data. Datasheet
Overview
Wireless Data Acquisition
Wireless data acquisition systems automate on-site measurements and transmit them to GeoCloud servers on the internet.
Better Data: Wireless data acquisition runs continously, provides frequent measurements in near-real time, and assists early identification of unwanted trends.
Reduced Costs: Wireless data acquisition eliminates the costs of installing and protecting long runs of cable.
Enhanced Safety: Wireless data acquisition eliminates most site visits and reduces the number of non-essential personnel on site.
GeoCloud Data Management
GeoCloud servers process incoming data, check for alarms, and update project databases.
Data Integration: GeoCloud servers can accept and store data from most sensors and systems, eliminating data silos.
Consistent Calculations: GeoCloud servers apply processing instructions as specified in the project database, providing consistency and traceability.
Human Monitored: GEO-Instruments project managers and technicians monitor project dashboards, checking that loggers and nodes are operational and that processed measurements are within alarm thresholds.
GeoCloud Websites
GeoCloud project websites provide data visualization via planviews, graphs, and reports.
Continuously Updated: GeoCloud websites always display the most recent data.
Consistent Presentations: Planviews, graphs, and reports are preconfigured to ensure consistent sensor selections, scales, and labels. Adhoc graphs are also supported.
Alerts: Alerts are posted on project websites and sent to registered users by email or text messages.
Secure Access: GeoCloud websites are hosted on secure GeoCloud servers and backed up daily.
Wireless Data Acquisition
Wireless Monitoring Systems
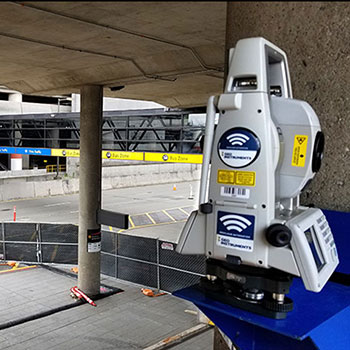
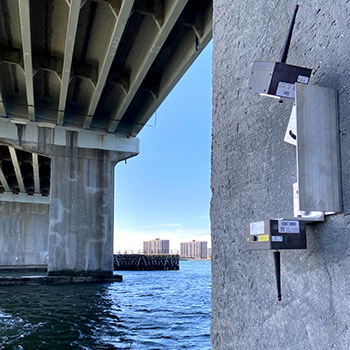
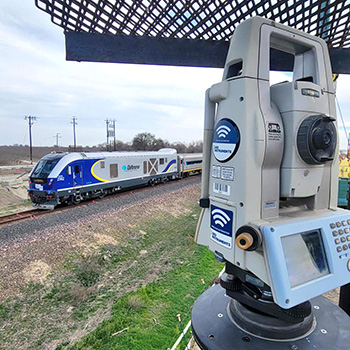
Wireless monitoring systems perform complex measurement & control functions to operate automated total stations, vibration monitors, dust monitors, construction cameras, and extended arrays of instruments. These data acquisition systems are powered by battery and solar panel and transmit measurements via cellular modems to a GeoCloud server on the internet.
Wireless Logger Networks
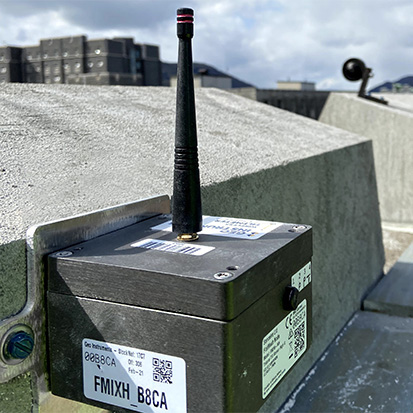
Wireless logger networks consist of nodes and a gateway. Nodes are small, battery-powered loggers that can be placed anywhere on the project site. Nodes transmit sensor readings to a gateway. The gateway collects readings from all of the nodes and forwards them to the GeoCloud server on the internet. See Wireless Logger Networks
Satellite & Cell Loggers
These compact, self-powered loggers have built-in cloud connectivity and can be deployed quickly with no need for protective enclosures, external power supplies, or internet gateways. Satellite versions are ideal for remote areas. Cellular versions are better for areas with cellular infrastructure. See Satellite Loggers
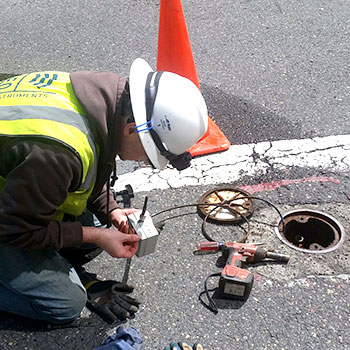
Wireless node installed in center of roadway transmits piezometer readings.

Wireless node reads strain gauges installed on a structural member.
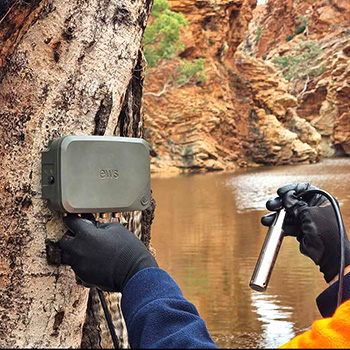
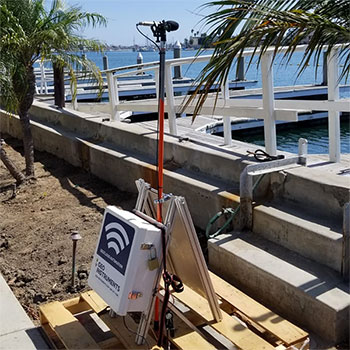
Satellite logger with piezometer monitors stream level at remote site.
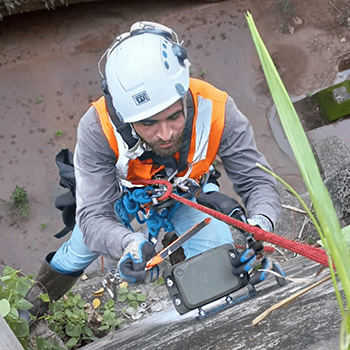
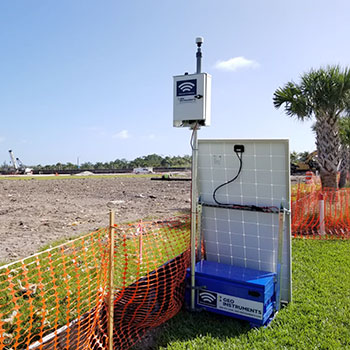
Satellite logger with built-in tiltmeter monitors retaining wall.
GeoCloud Websites - Apollo Data Visualization
GeoCloud servers receive and process measurements from the project site, check for alarm conditions, store the measurements in a project database. GeoCloud project websites provide visual access to the measurements via planviews, graphs, alerts, and reports. GeoCloud Websites - Apollo Data Visualization
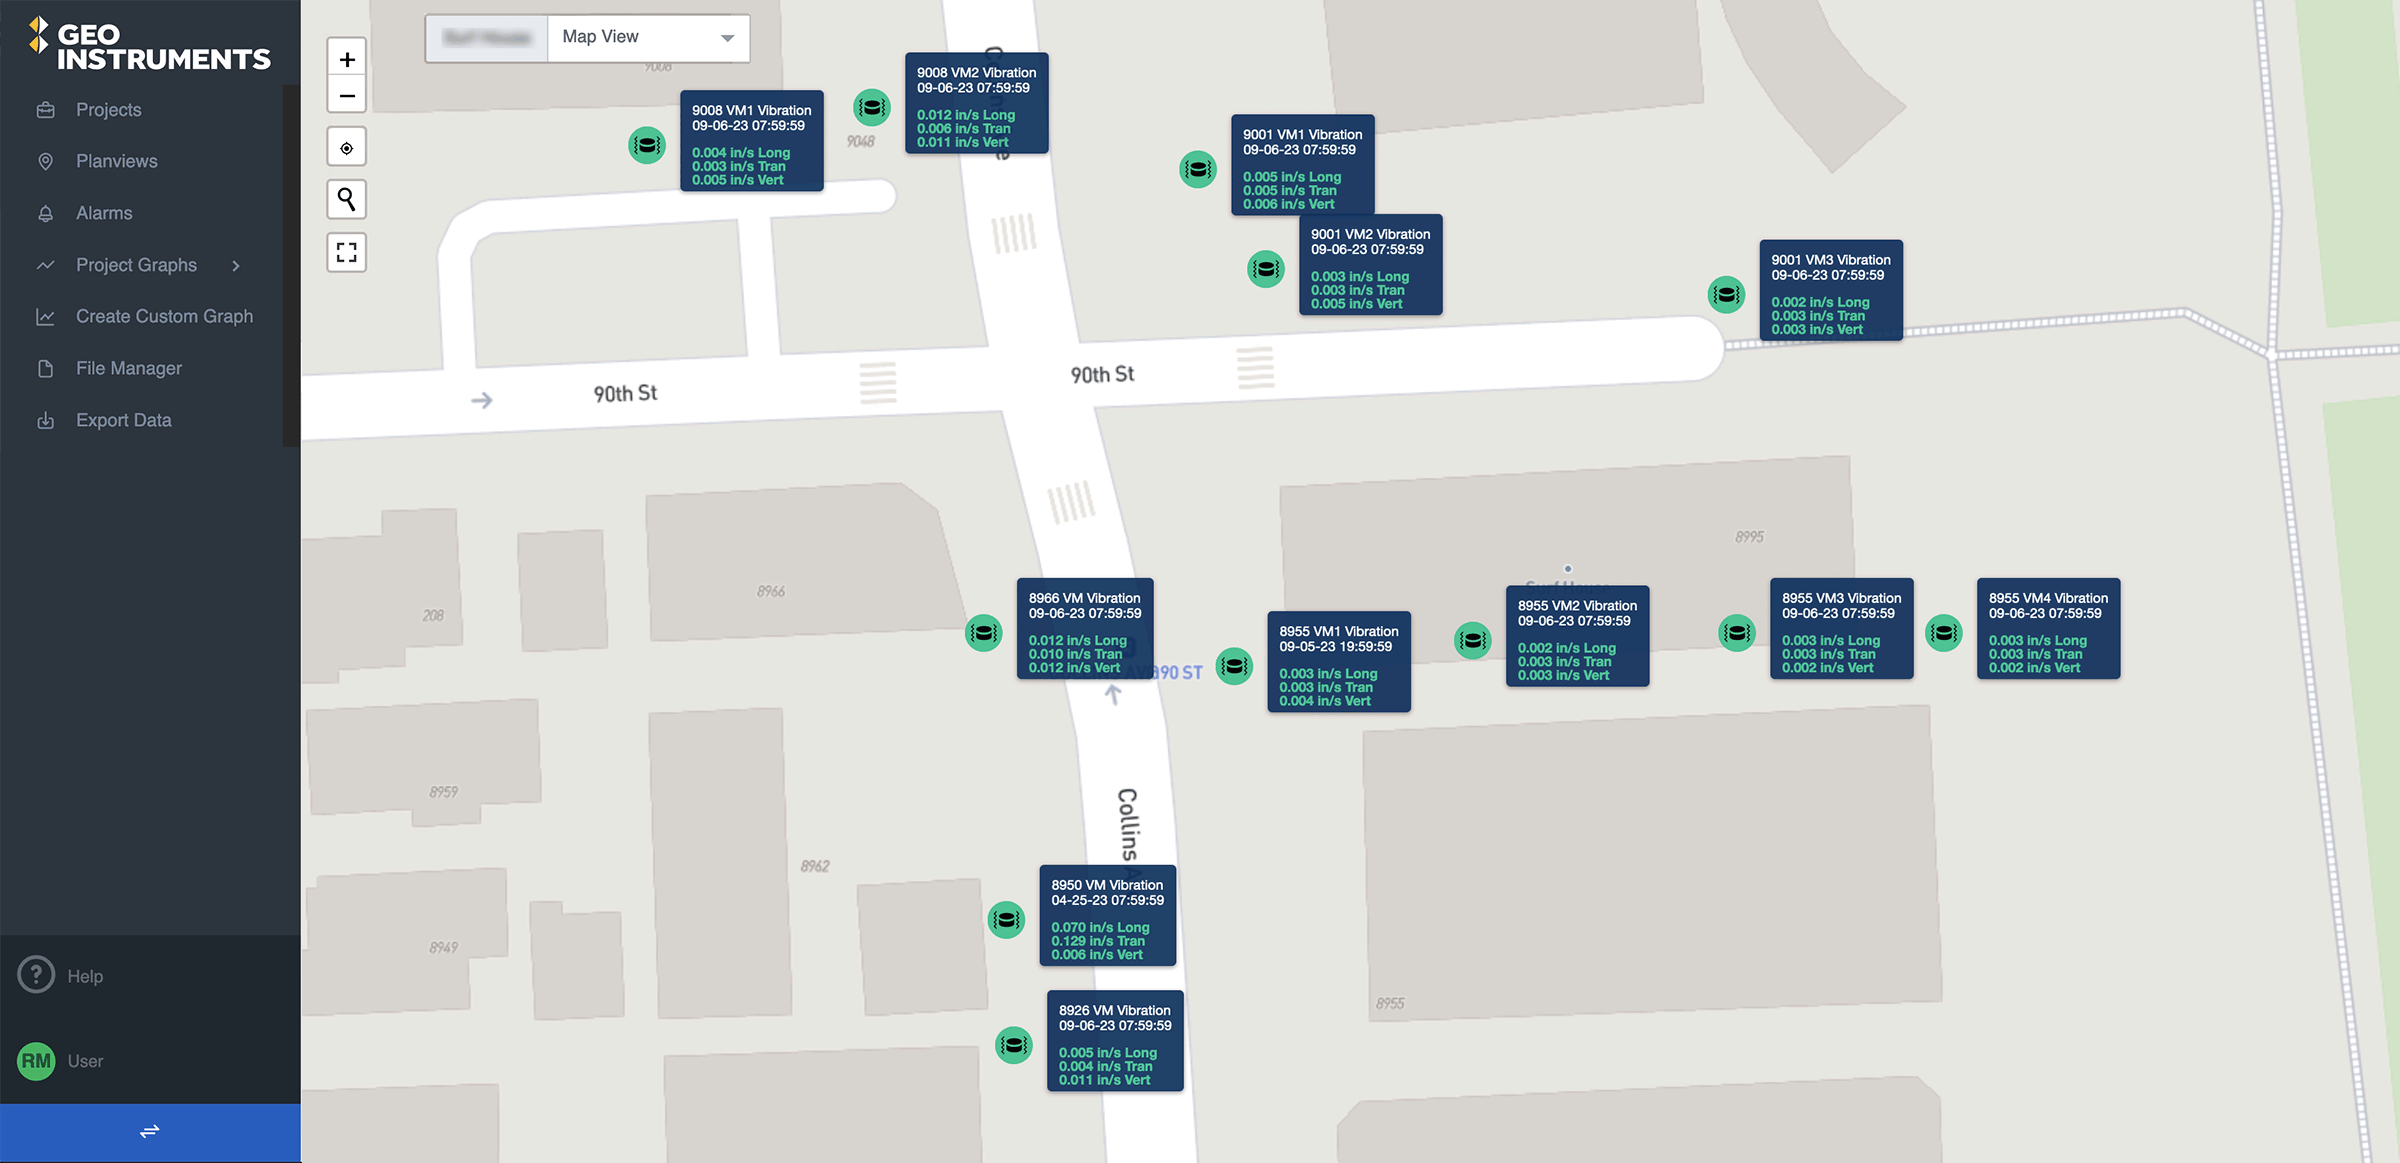
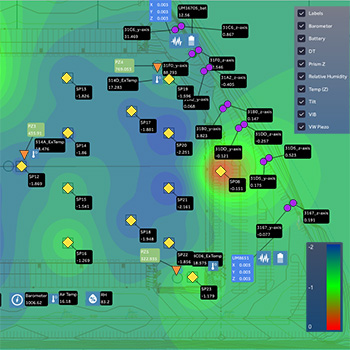
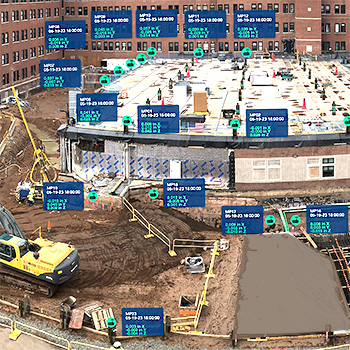
Planviews show sensors and their current readings superimposed on a graphical base layer, such as a CAD drawing, photograph, or satellite image.
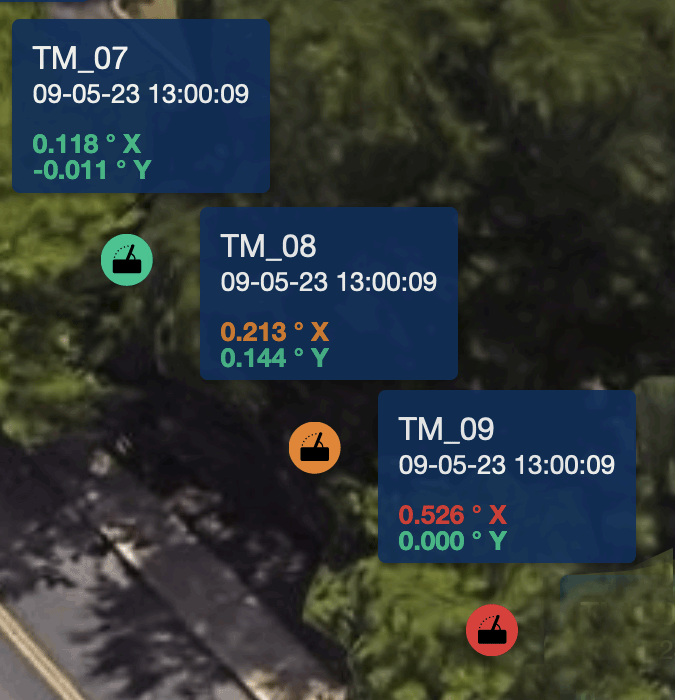
Alarm status is displayed on planviews. Alarm notifications are sent by text message or emails.
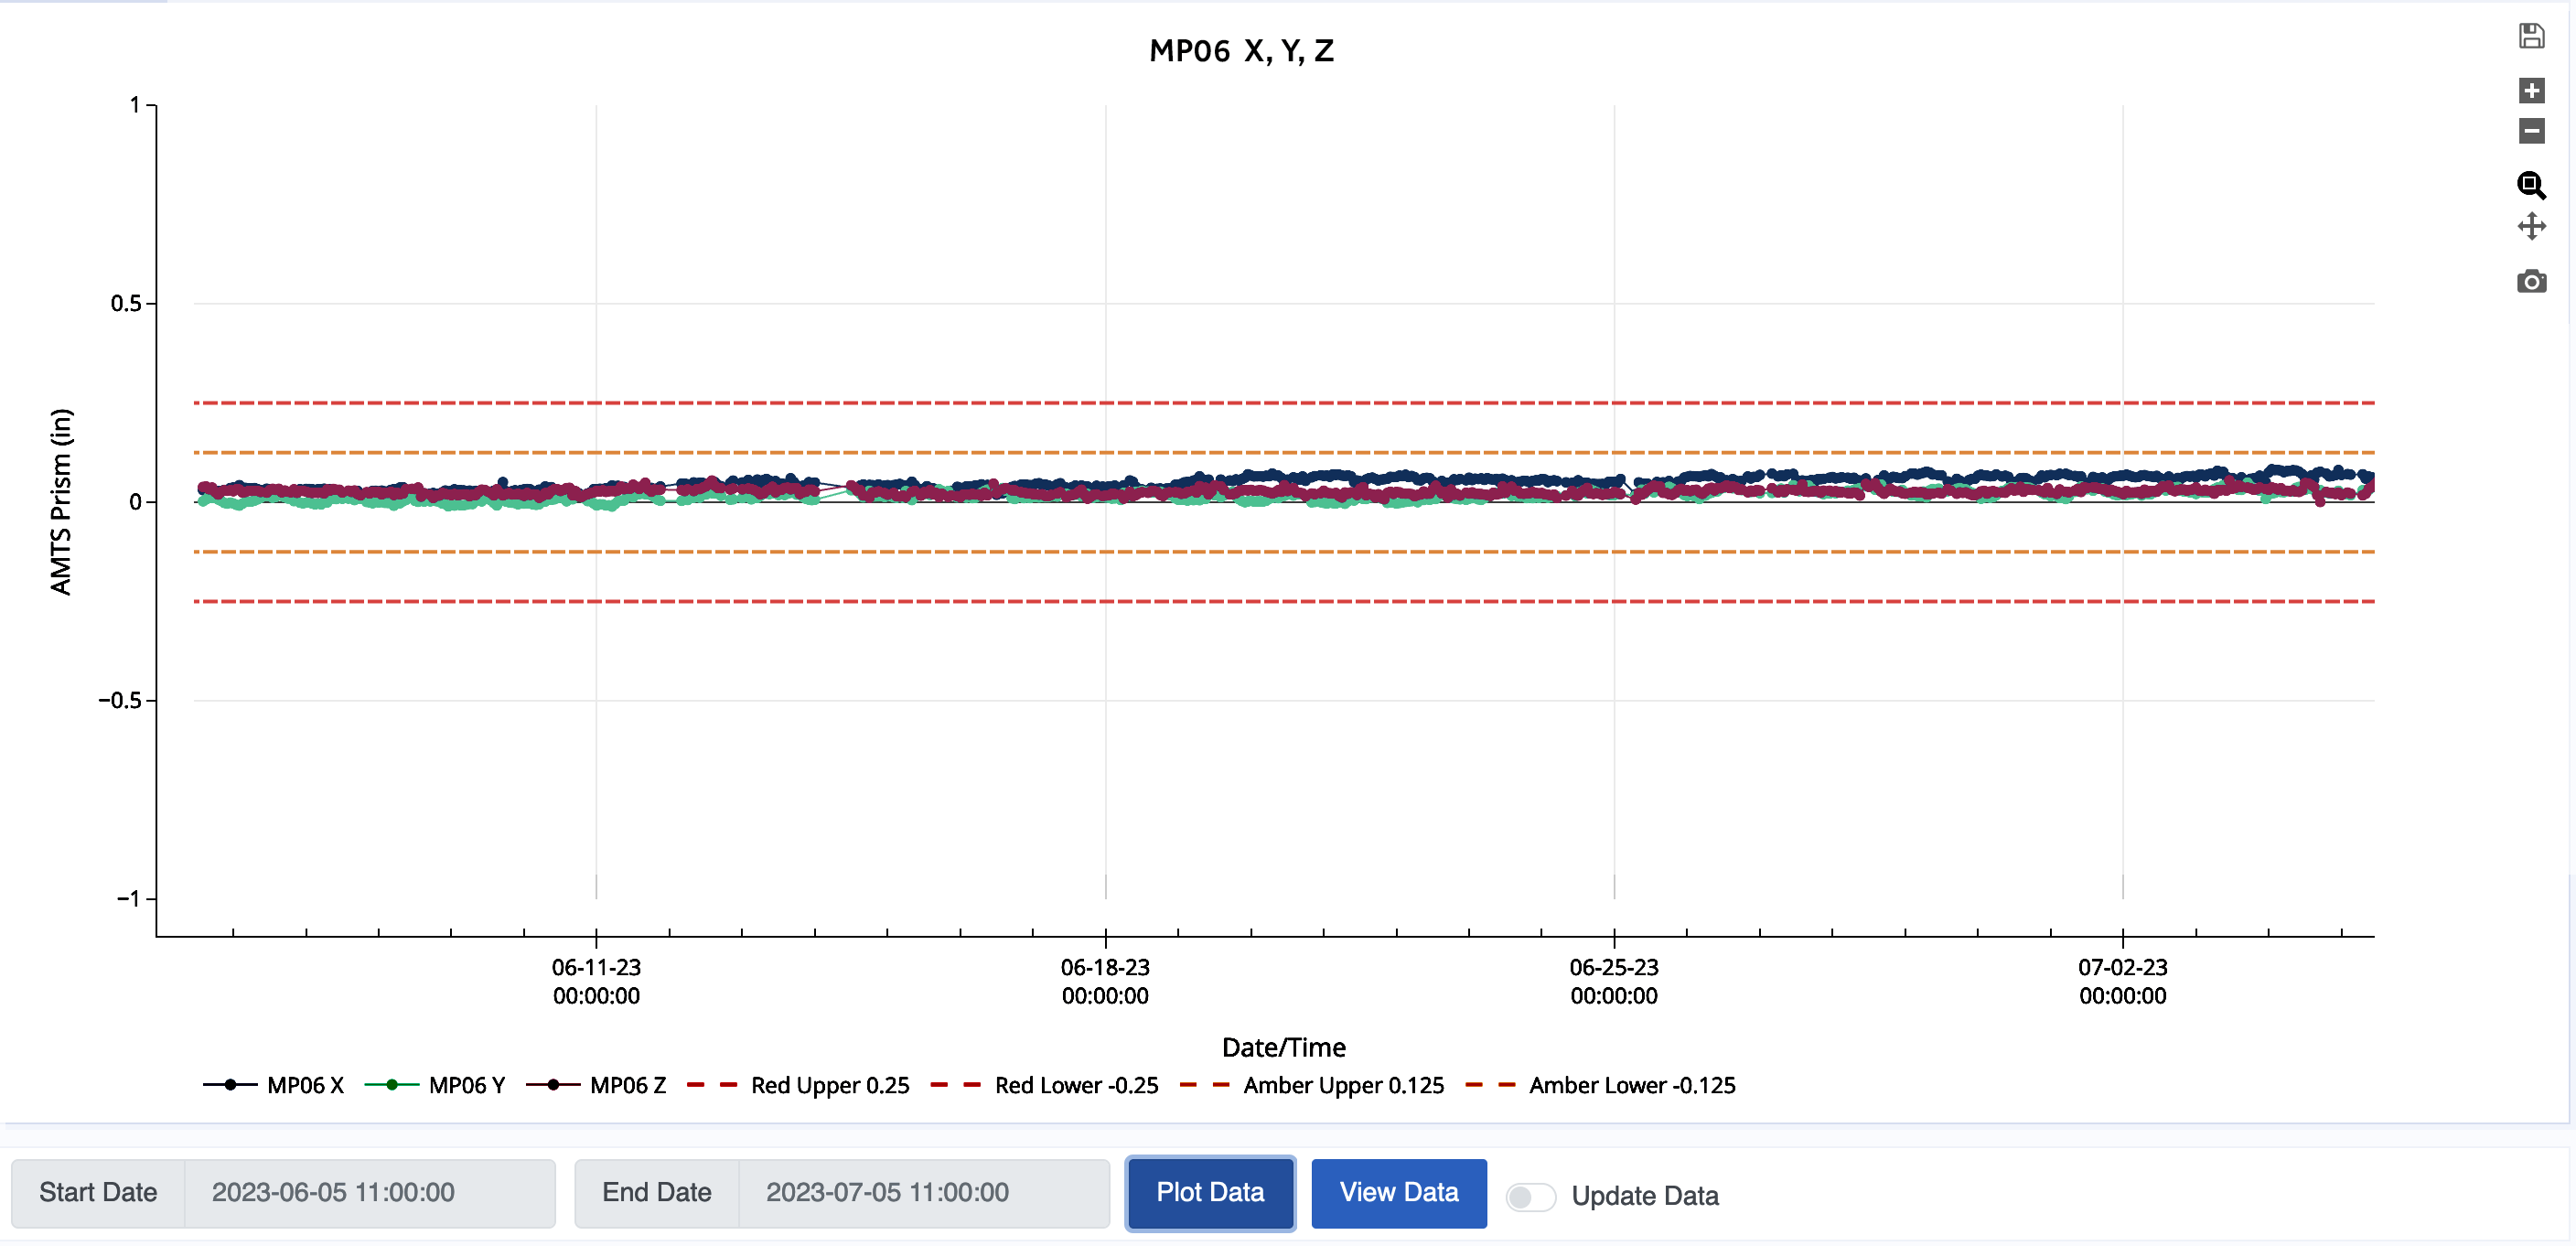
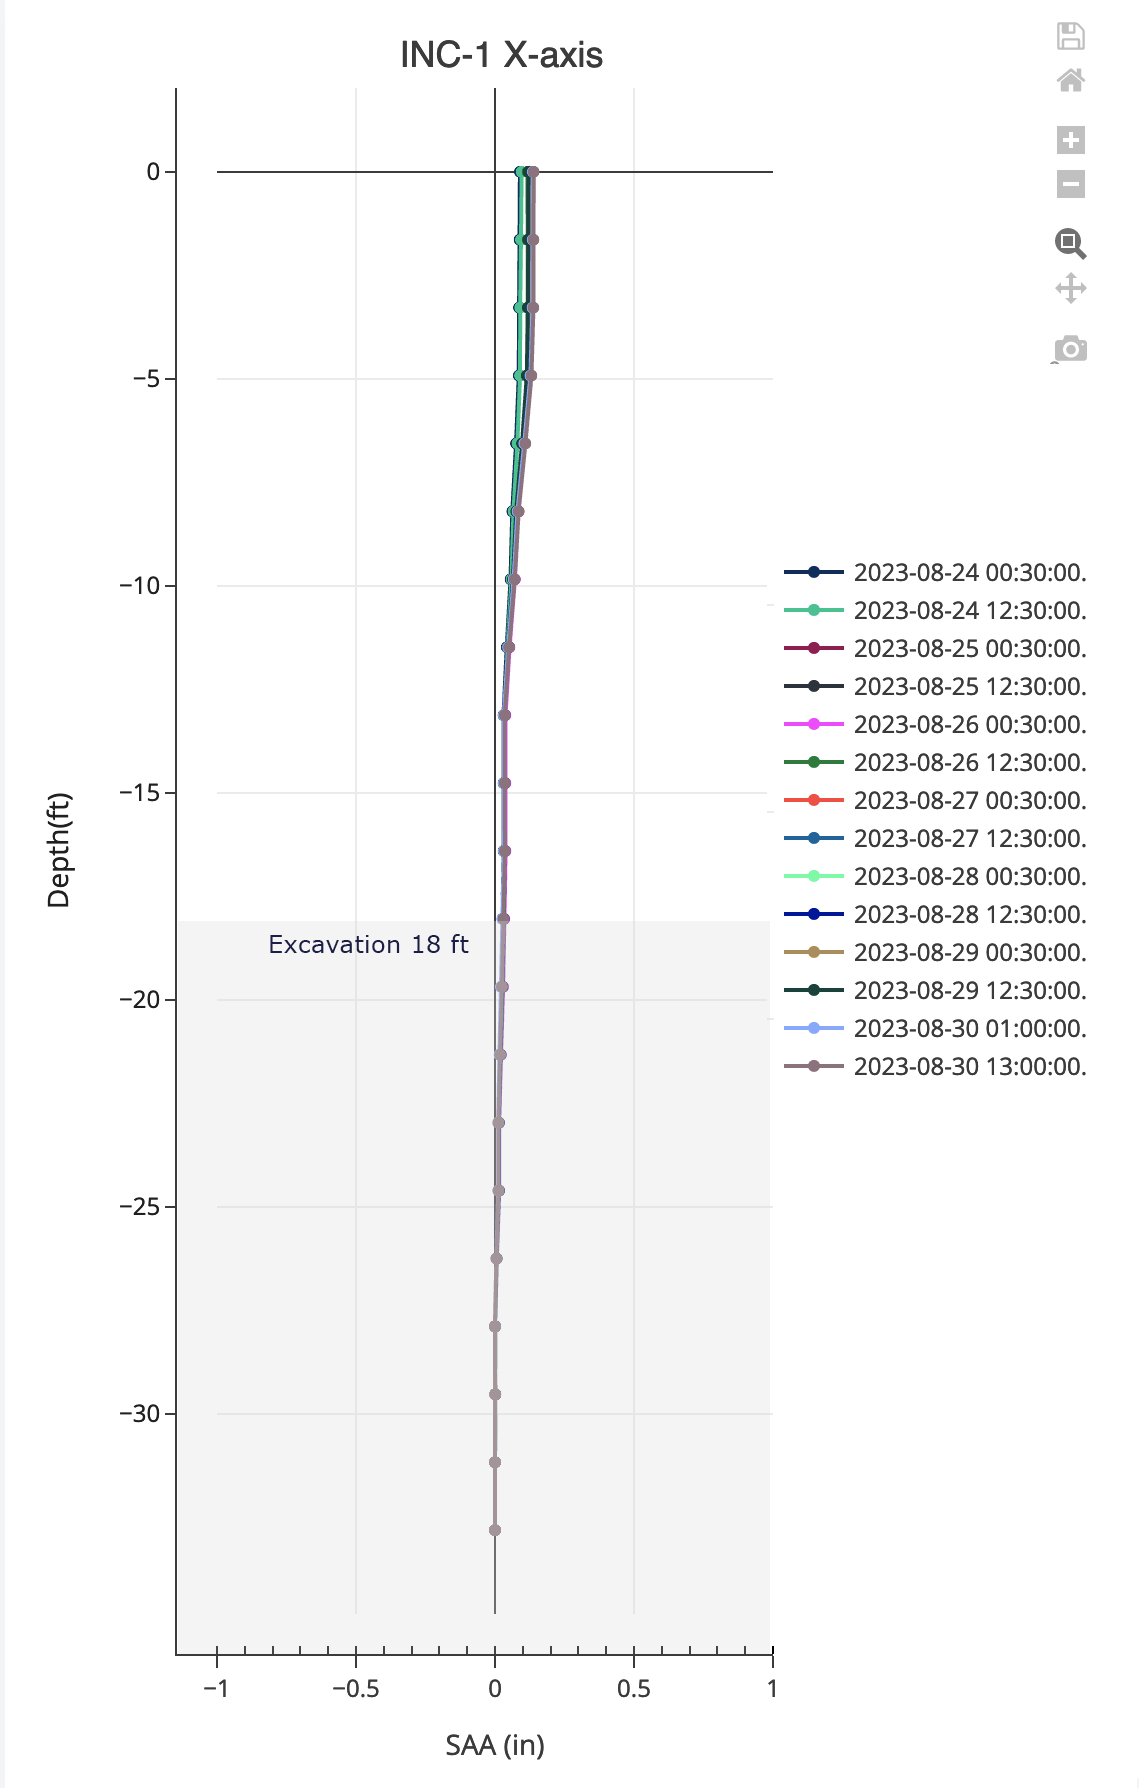
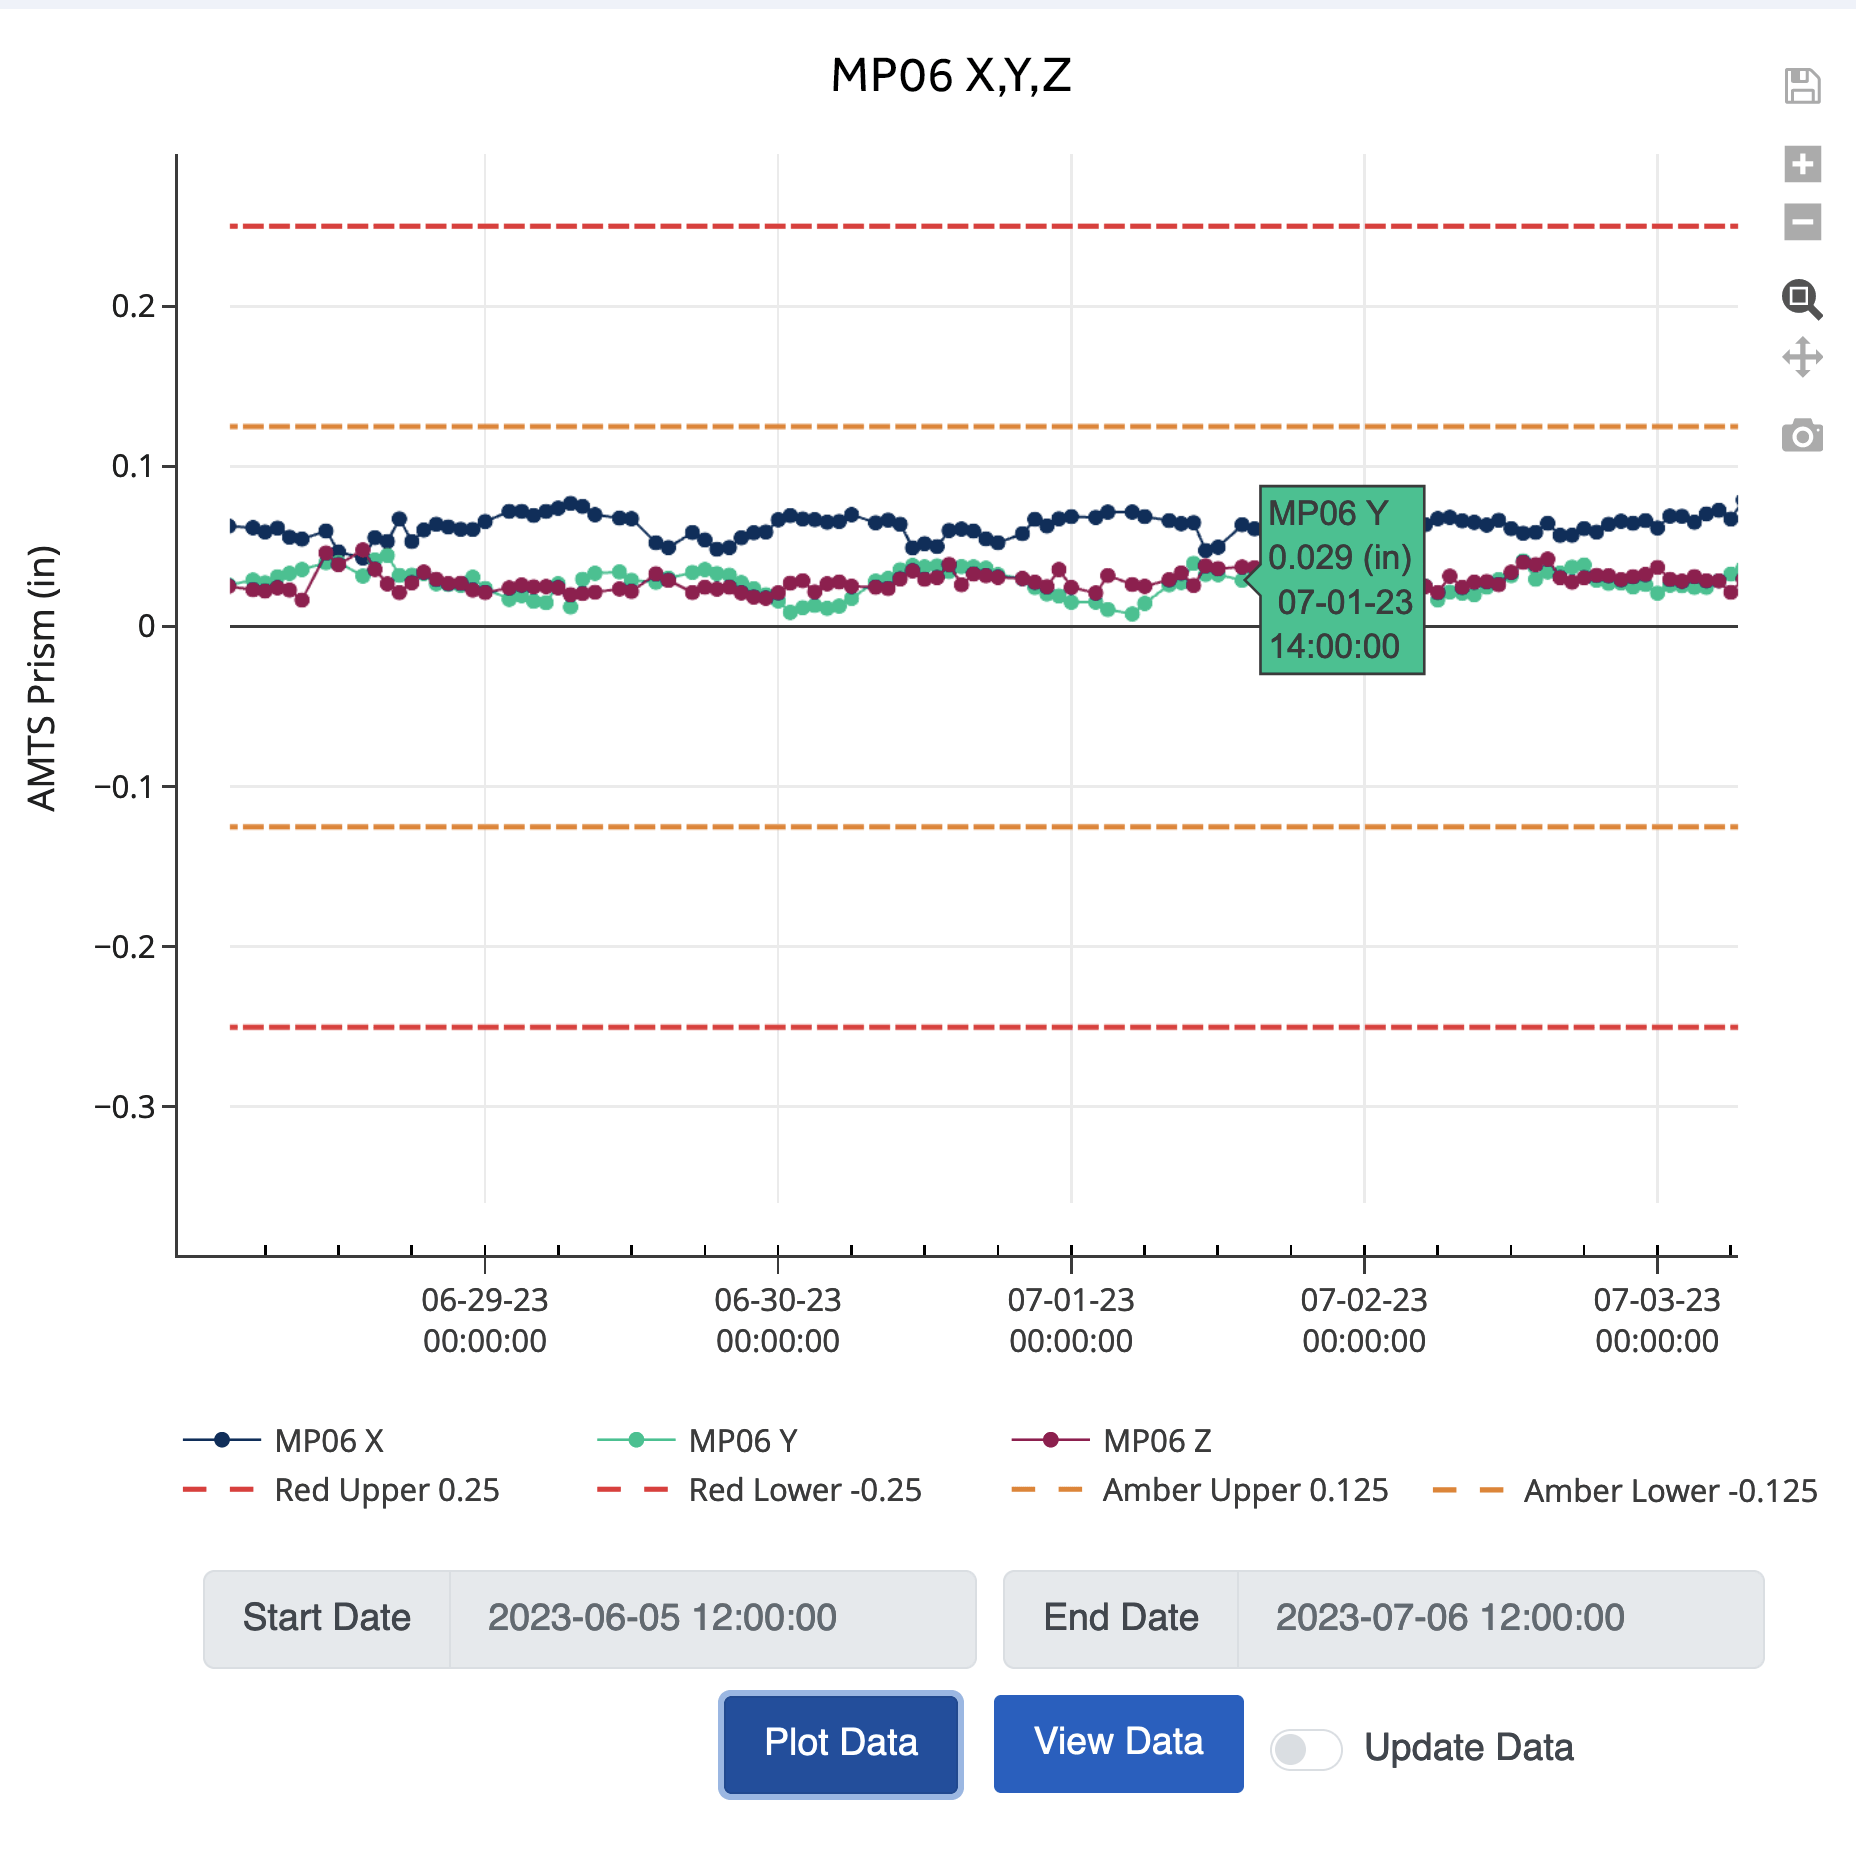
Graph types include trend plots, vertical and horizontal profile plots, contour plots, dedicated vibration monitor plots, and more.
Project graphs are preconfigured to customer requirements to maintain consistent sensor selection and scales. Users can also generate custom graphs for adhoc investigations. Sensors and alarm limits can be toggled on and off for both project and custom graphs.
