Vibration Monitoring Guide
Part 1 - Construction Vibration Overview
Why Monitor Construction Vibrations?
-
Risk Management
Excessive vibrations can lead to property damage, litigation, project delays, and increased costs.
-
Construction Control
Monitoring helps construction teams adjust their operations to avoid exceeding safe limits.
-
Compliance and Community Relations
Monitoring provides documentation to satisfy regulatory agencies and also helps builders manage relations with neighboring property owners, reducing complaints and project delays.
-
Legal Defense
Monitoring provides a record of vibrations from the site that can help resolve damage claims.
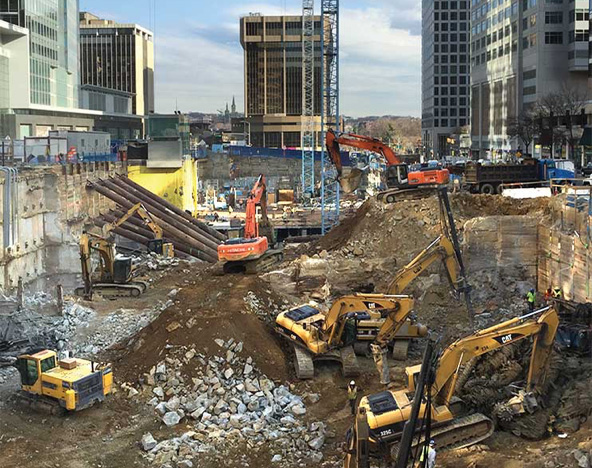
Vibrations from demolition and excavation can damage adjacent buildings and underground infrastructure.
Sources of Construction Vibrations
Main Sources of Vibration
Construction activities that generate the most vibration include:
- Clearing of the site, including demolition and removal of rubble.
- Compaction and leveling of foundation soils.
- Construction of deep foundations, including excavation, pile driving, and drilling.
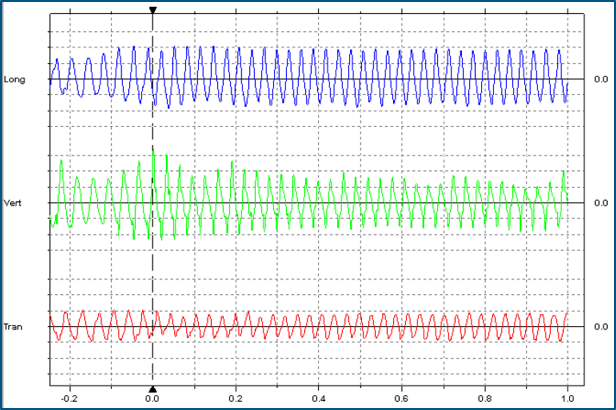
- Continous vibrations have more potential to cause damage.
Continuous Vibrations
- Vibratory compaction
- Vibratory pile driving
- Excavation equipment
- Pavement rubblizing
Transient Vibrations
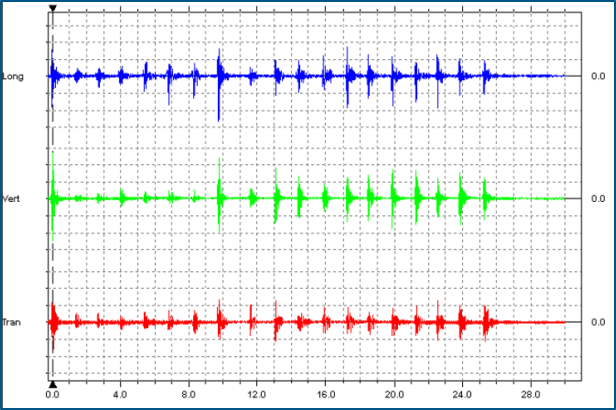
- Blasting
- Impact Pile Driving
- Dynamic Compaction
- Crack and Seat Equipment
What Vibration Levels Cause Damage?
The Potential for Damage
Factors affecting the potential for damage include:
Type of structure: Modern steel and concrete structures are less susceptible to damage than wood-framed and masonry structures.
Age of structure: Historical buildings or buildings that have experienced damaging events are more susceptible to vibration damage.
Function of structure: Some structures are used for vibration-sensitive activities and have vibration sensitive equipment.
Proximity of source: Ground vibrations attenuate with distance from the source of vibration.
Soil: Some soils, such as clays, transmit vibrations more efficiently than other types of soil.
Duration of vibrations: Continuous vibrations generally have more damage potential because they increase the chance of resonant amplification.
Frequency and velocity: Higher velocities and lower frequencies of particle motion are both more damaging.
Vibration Limits
Vibration standards provide guidance in setting safe vibration limits.
Standards & Vibration Limits
A paper by Mark Svinkin, available for free download from the ISSMGE online library, reviews a number of standards and vibration limits, including the widely referenced RI 8507 report.
It concludes that vibration impacts on structures are best monitored on the structures themselves; that ground vibrations should be measured for possible dynamic settlement; and suggests some generic limits.
FTA Manual
The FTA manual provides procedures for assessing the impact of noise and vibration from transit construction projects. More than half of the manual addresses noise and human factors. The vibration sections discuss project equipment, structure type, event frequency, and vibration limits.
Local Building codes
Local building codes are the primary guidance for most builders. Many of the codes are localized versions of the RI 8507 | OSMRE report.
Specialized Standards
Facility managers may have vibration limits to protect sensitive equipment and activities.
Types of Vibration Damage
Cosmetic damage includes cracks in plaster, drywall, masonry walls, and corner joints of windows and doors.
Structural damage may develop from differential settlement, either from vibrations directly or from densification of foundation soil and loss of support.
Functional damage may include disruption of vibration-sensitive activities and damage to equipment at hospitals, clinics, laboratories, data centers, and chip fabrication centers.
Recommended Practices
Background Vibration Levels
Vibration monitoring programs should collect background vibration levels before the project begins. Trigger levels set lower than background vibrations can lead to unnecessary stop-work interruptions.
Photo surveys
Pre-construction photo surveys document existing defects in structures adjacent to the project. Such surveys may be required by local bulding codes and can shorten any litigation of damage claims.
Part 2 - Vibration Monitoring Components
Essential Components
Triaxial Geophone
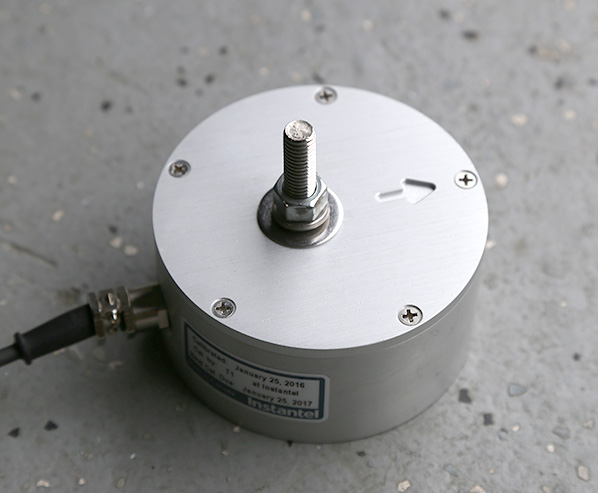
The triaxial geophone contains three sensors, each oriented to respond to particle motion in one of three vectors: transverse, vertical, and longitudinal.
Vibration Monitor
The vibration monitor powers the geophone, converts its signals to particle velocity, and checks peak particle velocity against preset limits.
Processing Software
Processing software imports data from the vibration monitor and generates compliance reports with histograms, waveforms, and limit graphs.
Geophones & Microphones
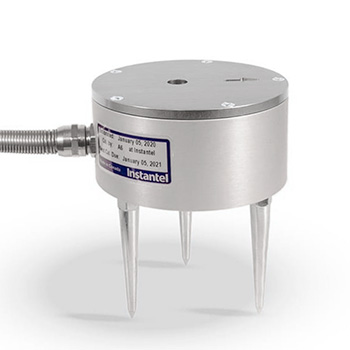
Standard Triaxial Geophone
The standard triaxial geophone is suitable for monitoring almost all construction vibration and blasting.
Standard geophones can be installed in the ground near affected structures or anchored directly to the structures.
- Calibration Standard: ISEE 2017
- Frequency Range: 2 - 250 Hz
- Velocity Range: Up to 10 in/s
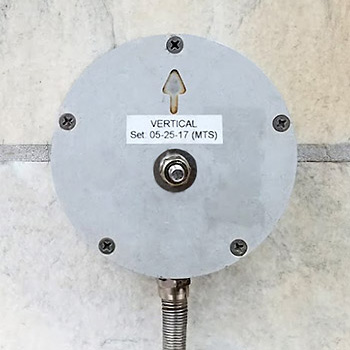
- Vertical version available for installation on walls
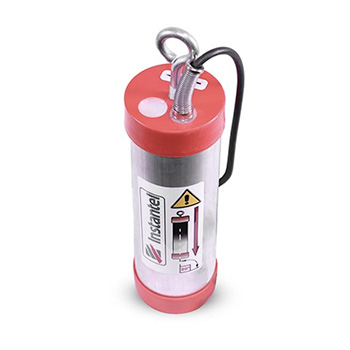
Triaxial Borehole Geophone
Construction vibrations may impact subsurface structures such as tunnels, utilities, and sewers. Direct access to these structures may be difficult.
The geophone is installed in a small-diameter 3" borehole drilled close to the subsurface structure.
- Calibration standard: ISEE 2017
- Frequency Range: 2 - 250 Hz
- Velocity Range: Up to 10 in/s
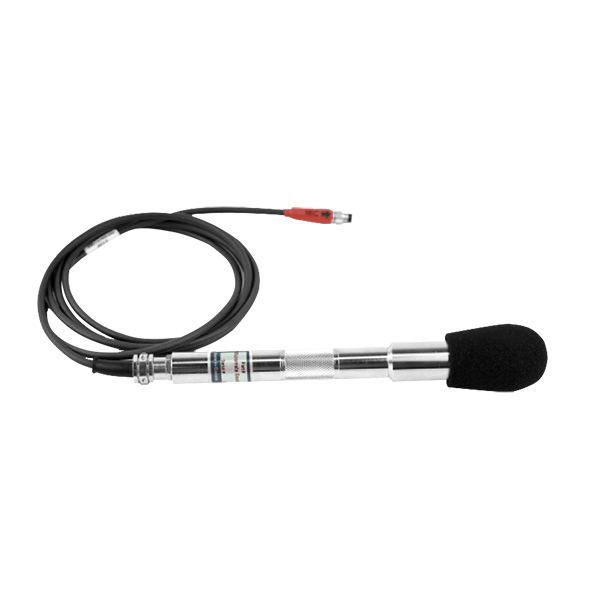
Microphone
Sound level microphones are tuned for sounds that humans can hear.
- Calibration Standard: IEC 61672-1
- Frequency Weighting: A or C
- Frequency Range: 10-20 kHz
Linear microphones measure air overpressure and are used for blasting.
- Calibration standard: ISEE 2017
- Frequency Weighting: Linear
- Frequency Range: 2-250 Hz
How are Geophones Installed?
Detailed instructions are available from manufacturers as well as published guidelines from the ISEE and FTA. In general, the geophone must be level within 10 degrees of horizontal and the arrow should point toward the source of the vibration.

Ground Installation
Most geophones include screw-on spikes to improve coupling with the ground. For short term monitoring, The spikes are pressed into the ground surface and the geophone is stablized with sand bags.
For longer term monitoring, the spikes and geophone are pressed into the bottom of a shallow pit and buried.
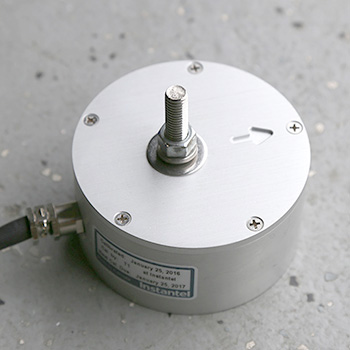
Slab Installation
Most geophones have through-holes for anchors installed in the structure. The geophone is slipped onto a threaded anchor and held in place by a washer and tightened nut.
Horizontal geophones are always oriented with the arrow pointing toward the source of vibration.
Wall Installation
Vertical geophones are available for installation on walls. Vertical geophones should be oriented with the arrow pointing upward.
Wall-mount adaptors are available for horizontal geophones.
Damage to the facade can be avoided by installing the anchor in the grout line.

Borehole Installation
The borehole geophone is lowered to depth with one axis oriented toward the source of vibration.
The borehole is backfilled to stabilize the geophone and ensure adequate coupling with the ground.
Sand backfill can be used in shallow boreholes. Deeper boreholes require grout backfill.
Vibration Monitors / Seismographs
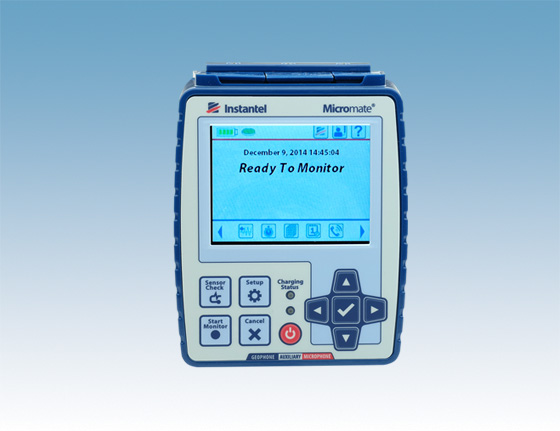
Standard Vibration Monitors
Basic Functions
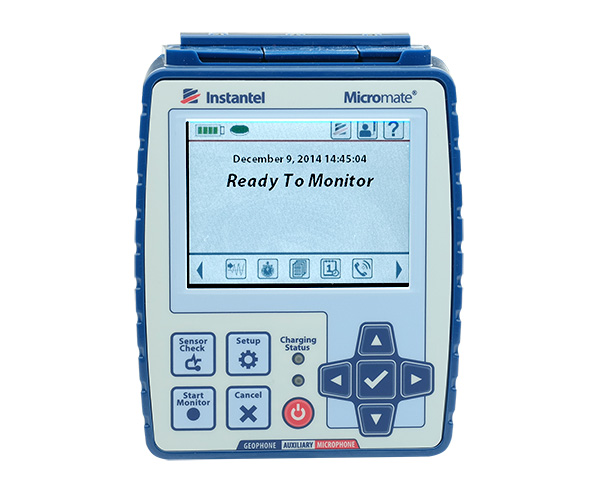
The vibration monitor, sometimes called a seismograph, samples signals from the triaxial geophone continuously, checking incoming values against limit thresholds.
The monitor stores the peak particle velocity (PPV) value for each vector at regular intervals. These values are used to generate a histogram report later.
If any incoming value exceeds the limit threshold, the monitor records all of the incoming values for a few seconds. These values are used to generate a waveform report.
Sample Rate & Recording
- Sample rate: up to 4096 S/s
- Trigger thresholds: 0.02 to 10 in/s
- Event recording: 60 seconds
- Data storage:
Sensor Support
Accepts 1 standard triaxial geophone and 1 microphone.
Data Transfers
Supports manual data transfers via a USB cable or flash drive.
Provides firmware support for wireless data transfers by cell modem, but does not supply the necessary hardware.
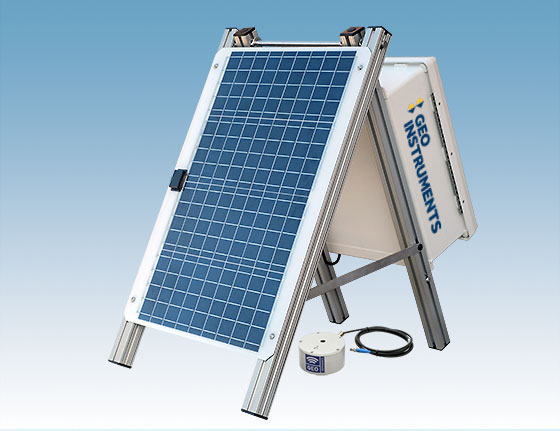
Hardware Enhancements
Solar power, wireless communications, and protective enclosures can increase efficiency and reduce costs.
Batteries & Solar Power
Supplemental batteries provide longer operation in all weather conditions. Solar panels keep batteries charged for even longer deployments.
Wireless Communications
Cellular modems transfer recorded data to the internet at regular intervals, eliminating the need for visits by a field technician. Wireless transfers also make timely alerts possible.
Protective Enclosures
Lockable, weatherproof enclosures hold vibration monitor, batteries, and modem. Protective enclosures allow the vibration monitor equipment to be left on site rather than collected at the end of the day. Various configurations are shown in Part 3.
Related: Advanced Vibration Monitors
Processing Software & Compliance Reports
Processing Software
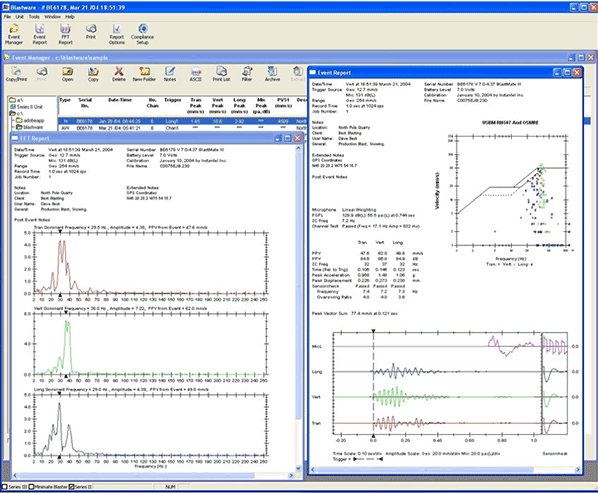
- Vibration monitors output their recorded measurements in binary code that can be parsed only with specialized processing software (Excel will not work).
- The software imports and processes data from the vibration monitor and then generates compliance reports that include limit charts, histograms and waveform plots.
- User can select from a wide variety of compliance standards.
- Compliance reports can be printed or output in standard file formats, such as PDF or CSV.
- The software or an add-on software module usually supports FTT and other analysis tools.
- Some software provides an API that allows developers to integrate vibration data into a broader geotechnical monitoring platform, such as GeoCloud.
Histogram Report
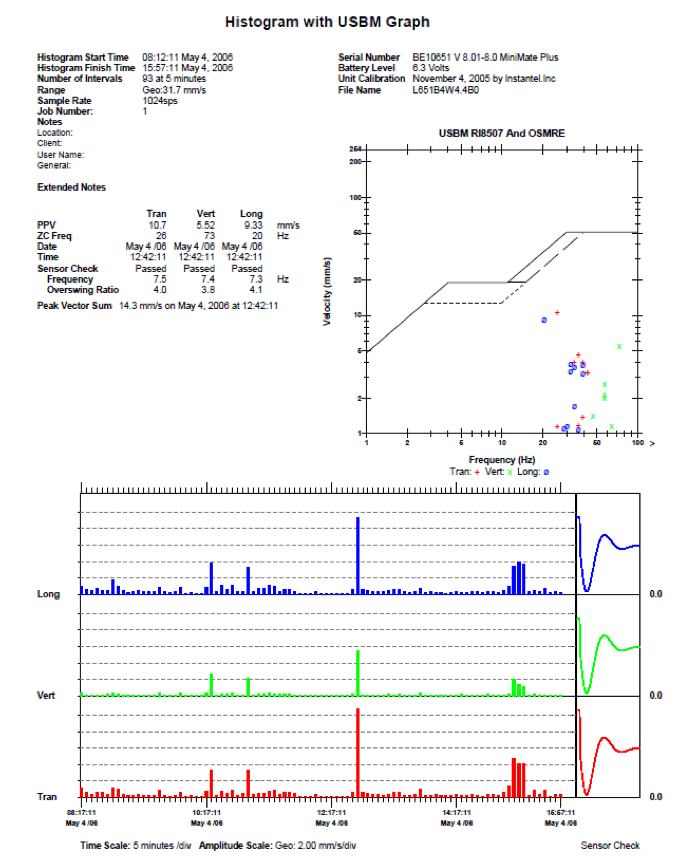
The histogram report shows the peak particle velocity measured during successive time periods.
Waveform Event Report
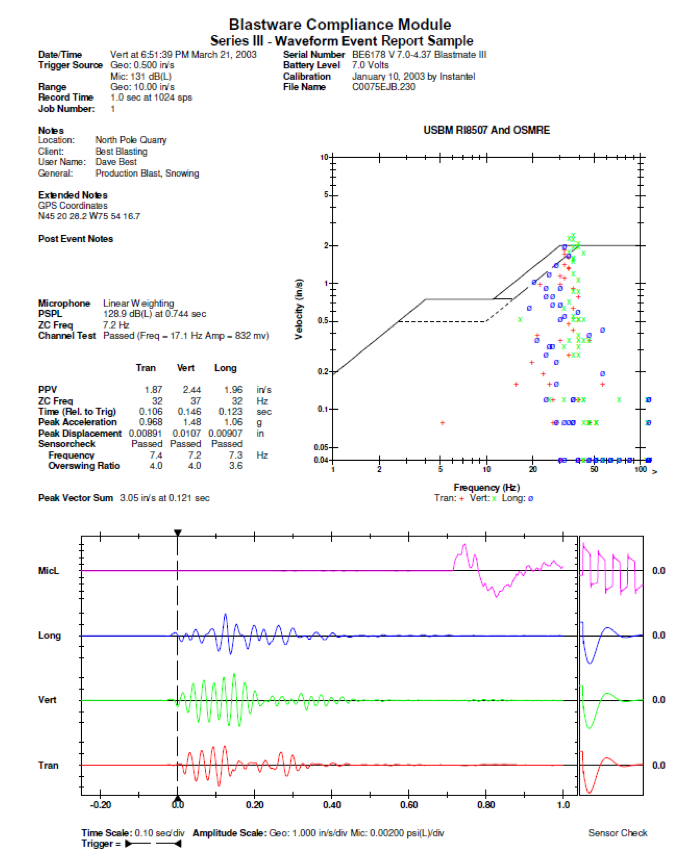
The waveform event report shows a single event, typically triggered by a limit exceedance.
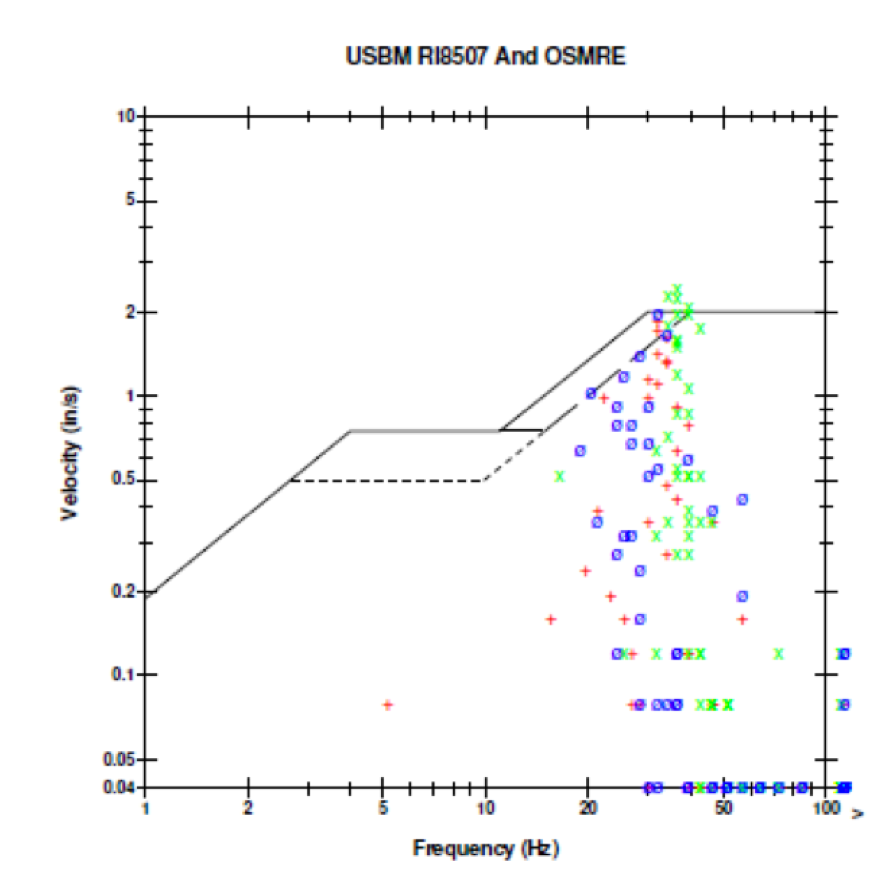
Vibration Limit Chart
The USBM RI 8507 vibration limit chart plots particle velocity against frequency and includes a safe-limit line.
Points above the limit line are potentially damaging. Points below the limit line are considered non-damaging.
Although intended to define safe limits for surface blasting and residential structures, the graph is widely used for construction vibrations and other types of structures.
Automated Vibration Monitoring
What is Automation?
Automated monitoring is a mix of hardware, software, and services that provides better data and eliminates nearly all the manual tasks related to data collection and processing.
Hardware
Hardware required for automation typically includes supplementary power, wireless modems, and protective enclosures.
Automatic Data Uploads
Cellular data services are required for data transfers, which typically occur 4 or 5 times per day, or immediately if measurements exceed vibration limits.
Automatic Processing
The website automatically imports incoming data into its processing software and generates histogram and waveform reports.
Timely Alerts
Alerts for vibration exceedances are displayed on the project website and can be sent to smartphones and PCs.
Easy Access to Reports
The website stores compliance reports for easy access by pc or smartphone. Nothing gets lost.
Data Integration
Vibration monitoring is often part of a larger monitoring program, that includes crackmeters, tiltmeters, shape arrays, utility monitoring points, and automated total stations. The website can display the status of all of these on the same screen.
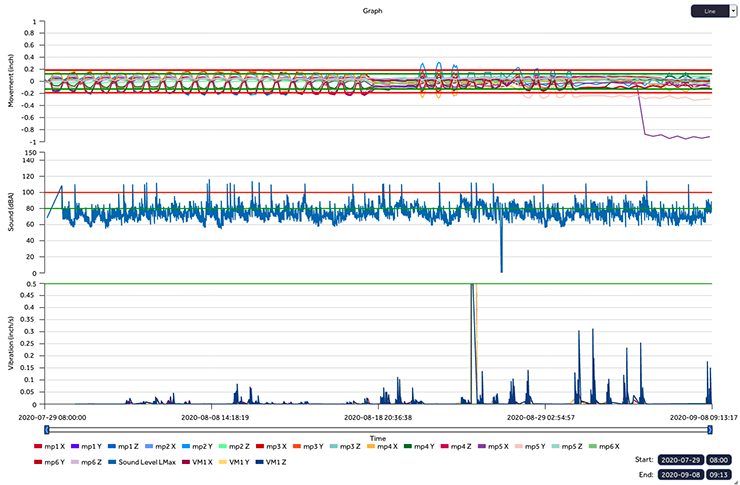
This plot from GeoCloud Quickview shows movement recorded by an AMTS system, noise levels recorded from a sound level sensor, and vibrations recorded from a geophone.
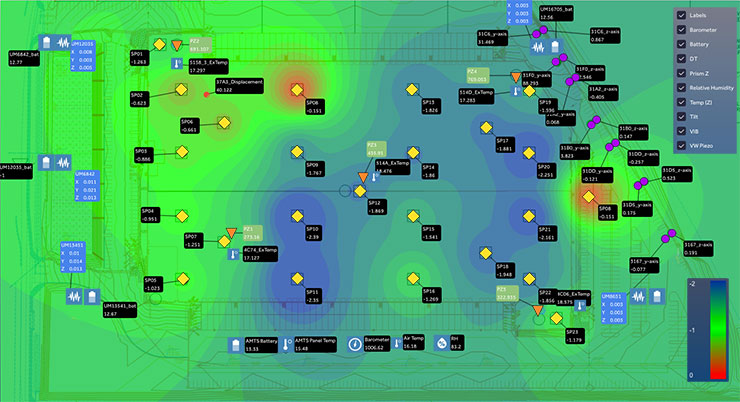
This status screen from GeoCloud Quickview is another example of data integration. A single screen shows settlement, tilt, peak particle velocity (blue boxes), pore-water pressure, and weather conditions.
Part 3 - Vibration Monitor Comparisons
Portable Monitors
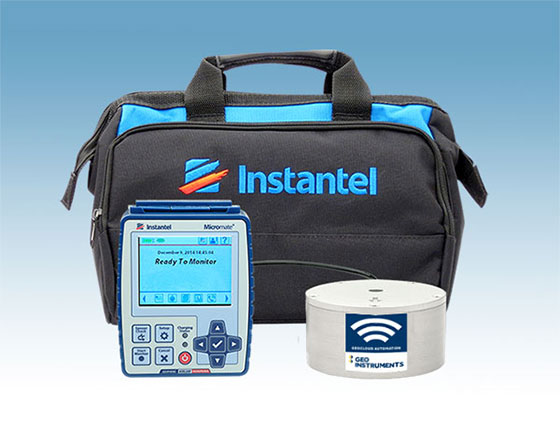
Instantel Micromate
The Micromate is a good choice if your reporting requirements are minimal and you don't need automation.
Compact and lightweight, the Micromate is also convenient if your monitoring location changes frequently.
The Micromate should be retrieved at the end of the day. You'll need to transfer data to your PC for processing, generate reports, clear the Micromate's memory, and charge the battery.
Monitoring Time:
10 to 15 days of monitoring on rechargeable internal battery.
Dimensions and Weight
4 x 5.5 x 1.75 in, 1.1 lb
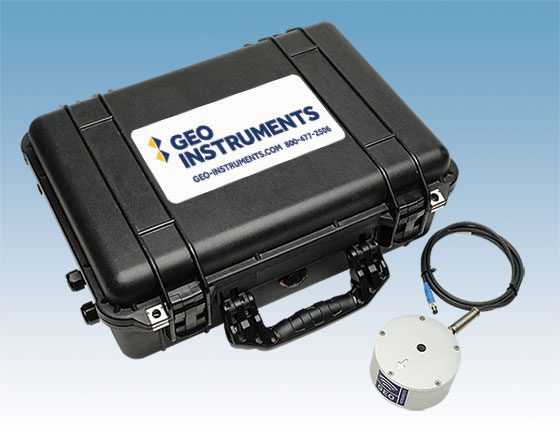
PVM - Portable & Automated
The PVM is a good choice if you need protected portability. It is supplied in a strong waterproof case that can be locked, secured, and left on site.
The PVM is available with and without automation services. Automation brings automated data retrieval and website access to automated reports.
With the non-automated PVM, you'll need to transfer data to your PC for processing and generate reports.
Monitoring time:
Three days of automated operation, 20+ days of non-automated operation.
Dimensions & Weight:
20 x 15 x 7 in, 26 lb.

SVM - Solar & Automated
The SVM is a good choice if you need portability and automation for a longer term. It can be locked, secured, and left on site in a fenced area.
The SVM features a self-standing frame that folds for easy relocation. The solar panel keeps its large battery charged for weeks of automated operation.
All automated systems send data four or five times per day to a dedicated website where reports are generated.
Monitoring Time:
Weeks of operation, depending on the availability of sunlight.
Dimensions & Weight:
30 x 18 x 11 in (open), 60 lb.
Fixed-Location Monitors
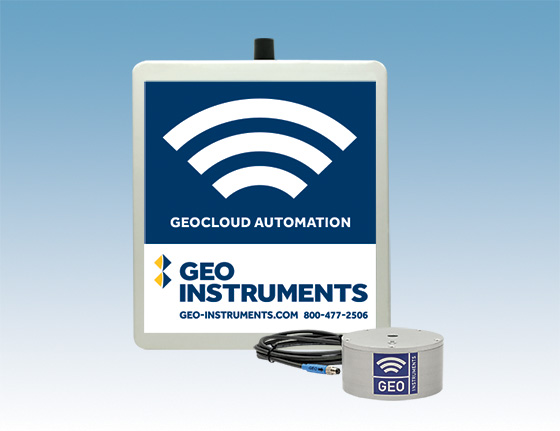
AVM - Automated AC or Solar
The AVM is a good choice for long term automated monitoring from a fixed location. Its weatherproof enclosure can be mounted on a wall or pole.
The AC version charges the battery from line power, providing unlimited operating time. The solar version is supplied with a separate solar panel and a larger battery.
Monitoring Time:
AC version has no monitoring limits. Weeks or months of monitoring with solar, depending on availability of sunlight.
Dimensions & Weight:
18 x 16 x 6 in, 32 lb.
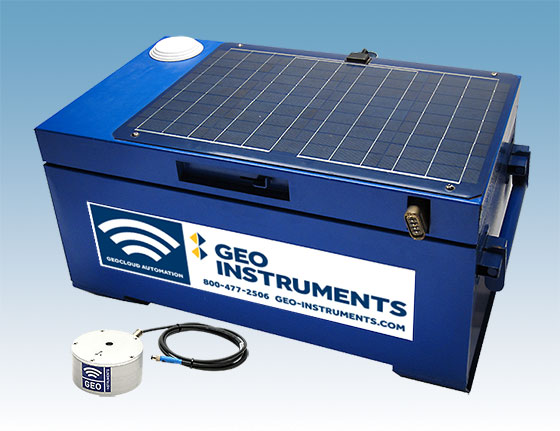
RVM - Solar and Rugged
The RVM is a good choice for long term automated monitoring from a fixed, public location. It features a heavy steel enclosure, a shatterproof solar panel, and high capacity batteries.
The enclosure can be positioned over the installed geophone and its cable to avoid vandalism. The 250 lb enclosure is lockable and easily secured.
Monitoring Time:
Large batteries provide extended monitoring time even with poor solar. Months of monitoring with good sunlight.
Dimensions & Weight:
31 x 21 x 18 in, 250 lb.
Choosing a Vibration Monitor for your Project.
Here are some factors to consider when choosing a vibration monitor. Visit our rentals page for more details.
- Do you need portability? Will the monitor be relocated often?
- Is access to the monitor easy? Are there safety concerns? Will you need escorts?
- How secure is the work site? Does the monitor need extra protection?
- Is automation cost-effective? Will you lower costs with fewer site visits and less time generating reports?

