Monitoring Soil Consolidation
GEO-Instruments automates monitoring of surcharge-induced soil consolidation. Datasheet
Instrumentation
Surcharge-induced consolidation is a technique used to improve the bearing capacity of foundation soil and to prevent later settlement.
Piezometers monitor the excess pore-water pressure induced by the surcharge and the eventual dissipation of the excess pore-water pressure.
Settlement plates are used to confirm that settlement is occurring at the predicted rate and magnitude.
When settlement and pore-water pressure stabilize, the process of consolidation is complete and the surcharge can be removed.
Automation
Pore-pressure measurements are automated by connecting piezometers to compact wireless loggers. The loggers obtain measurements and transmit them to the Cloud via an internet gateway.
Settlement measurements are automated by optical monitoring using prisms and AMTS or by geodetic monitoring using GNSS sensors. Both systems transmit measurements to the Cloud.
A GeoCloud server receives and processes the measurements and then posts alerts, graphs, and reports on a secure Geocloud project website.
Advantages of Automation
Cost & Safety: Automation helps control costs and enhances site safety by reducing the need for on-site visits by instrument technicians and survey crews.
Data Reliability: Automation increases reliability and confidence in the data by obtaining measurements at frequent intervals.
Data Visualization: Automation presents data graphically on a secure website that is updated continuously and is available 24/7.
Piezometers
Piezometers are installed to monitor pore-water presssure at specified locations and depths within the treated area.
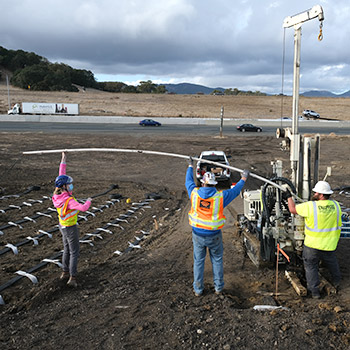
When ground conditions permit, a wick-drain rig is used to install the piezometers. Otherwise, piezometers are installed in boreholes.
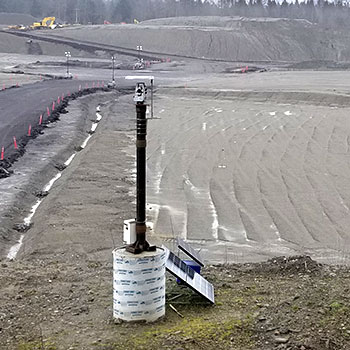
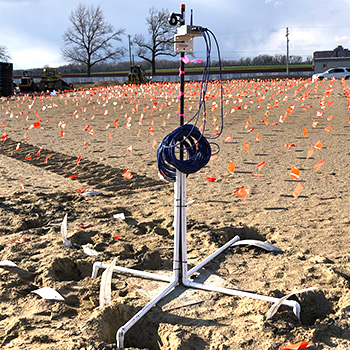
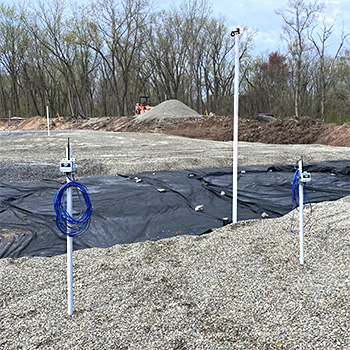
Automated Measurements: Compact, self-powered wireless loggers take readings at scheduled intervals. Photo at right shows a logger and prism attached to the riser. Extra cable allows for riser extensions.
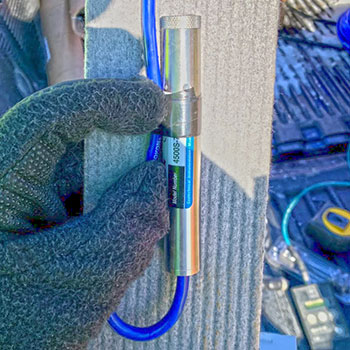
Piezometer prepared for installation by a wick-drain rig.

Piezometers installed at different elevations around settlement plate.
Settlement Plates
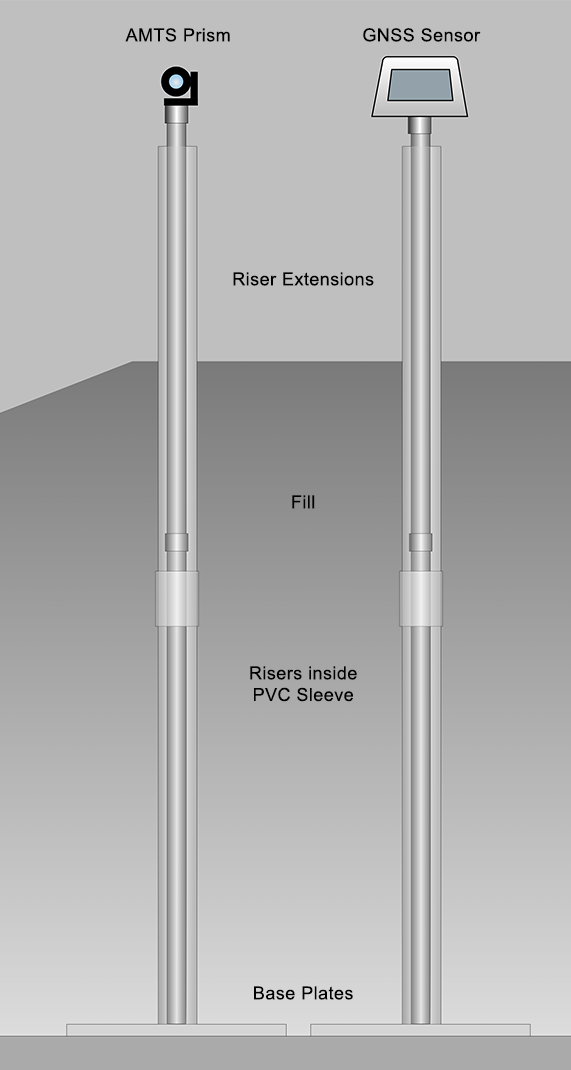
Settlement Plate Components
Settlement plates are installed at specified locations within the site. Typical components include:
Base Plate: 24 x 24 x 0.25 inch steel plate with connection for riser
Riser: 1-inch threaded steel pipe, typically supplied in 5-foot lengths. Threads allow extensions to be added.
Sleeve: 1.5-inch PVC, typically supplied in 5 foot length. Optional or required, depending on project specifications.
Riser Extensions: Riser & sleeve extensions, with couplings, required as height of fill increases.
Top of Riser: Prism or GNSS sensor
Automated Measurements
AMTS: Settlement plate risers are fitted with prisms. A solar-powered AMTS system is positioned for good sight-lines to each prism. The AMTS measures and transmits prism elevations to the internet at regular intervals.
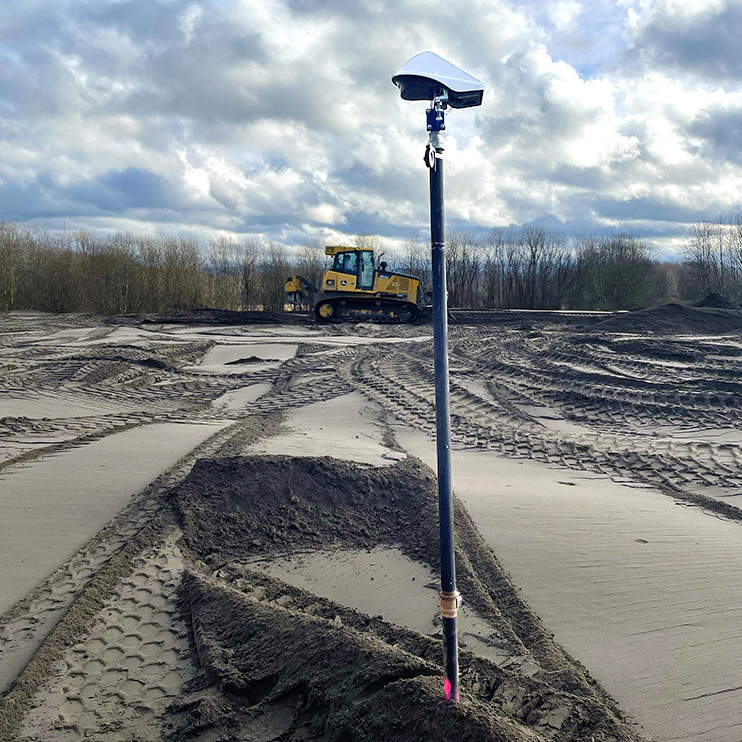
GNSS: Settlement plate risers are fitted with compact, self-powered GNSS sensors that transmit elevation measurements to the internet at regular intervals. GNNS sensors also feature ground-facing radar sensor that reports sensor-to-surface distances.
AMTS Automation
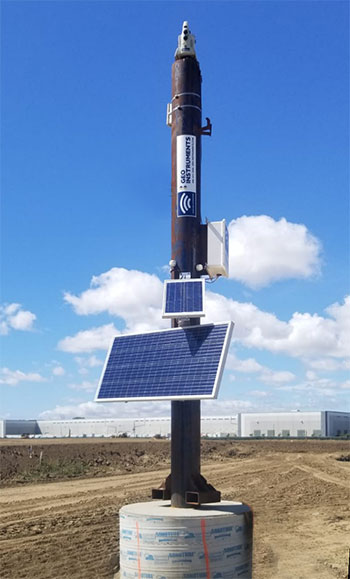
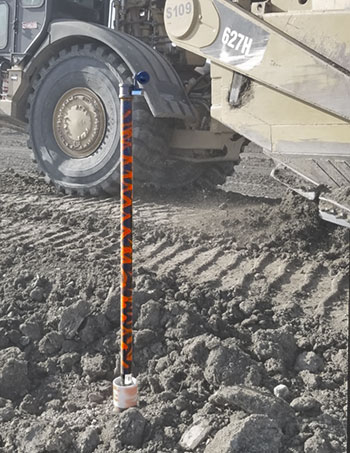
The AMTS system (left) is mounted on a gravity base tower to provide good sight-lines to prisms that are installed on the settlement plate risers (above).
GNSS Automation
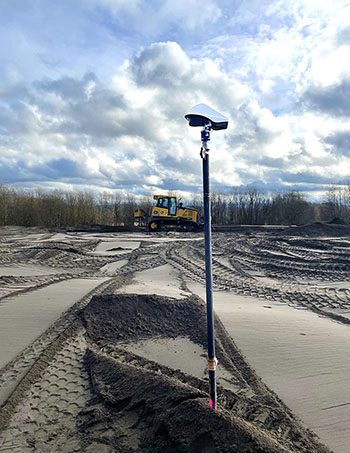
The GNSS sensor installed on the settlement plate riser (above) reports its geodetic observation directly to the Cloud for processing.
GeoCloud Project Website
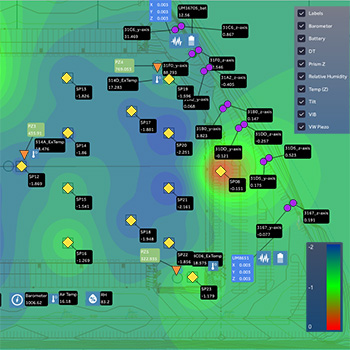
Measurements transmitted to the internet are collected and processed on a Geocloud server and then displayed on a secure GeoCloud project website. The website automatically generates graphs, reports, and views such as the contour plot below. Authorized users can access the website with smartphones, tablets, and desktop computers.
Trend Plot
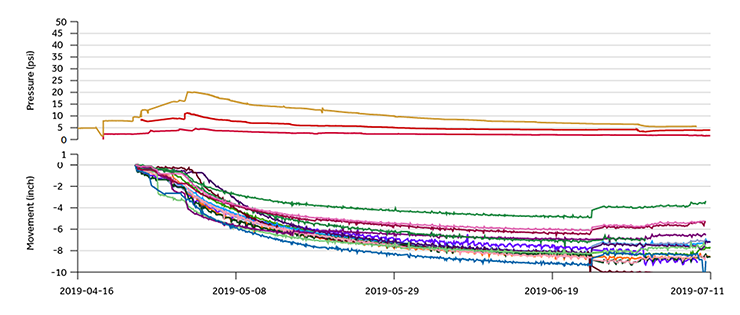
This combination plot shows pore-water pressure (top) and settlement. Pore-water pressure increases as the surcharge is placed and then dissipates over time. Settlement follows the decrease in pore-water pressure and then shows a slight rebound when the surcharge is removed.
Contour Plot
This video animates a series of contour plots derived from settlement plate data. Red shows the least settlement, blue shows the most. The surcharge was placed from left to right. The plot also shows data for piezometers, tiltmeters, and vibration monitors.
