Spokane River Bridge
The BNSF Spokane River Bridge project involves construction of a new rail bridge adjacent to the existing bridge. Geo-Instruments is monitoring the existing bridge for potential impacts from the construction, which includes vibratory pile driving for a temporary pile-supported work trestle.
GEO deployed three automated monitoring systems that separately report displacements, vibration, and tilt measurements to a GeoCloud project website. The website continuously updates graphs and data for all three systems, sends alerts as needed, and generates weekly reports.

Monitoring Displacements
Displacements, including settlement, are monitored at 12 measurement points by a single AMTS system. Measurements are reported at 4-hour intervals initially but can be shortened to 1-hour intervals, if necessary. At maximum distances of 500-feet, the system provides measurement accuracy of around ±1 mm.
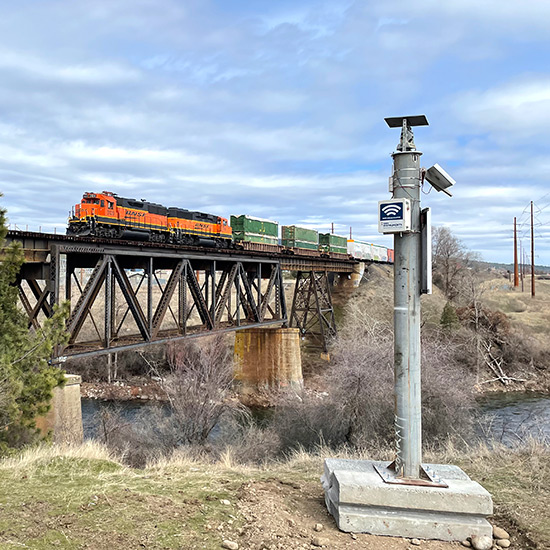
The AMTS is positioned on a free-standing tower about 16 feet high. The tower provides uninterrupted lines of sight to all of the the monitored elements as well as security for the instrument.
L-bar mini prisms are installed at the measurement points using clamps on steel elements and masonry anchors on concrete elements. Reference prisms are installed at stable locations outside the zone of influence.
The photo shows the AMTS system on its gravity-base tower. The tower also supports two solar panels and a gateway for the wireless tiltmeters.

Monitoring Vibration
Vibration levels are measured by automated vibration monitors installed on two abutments, two steel bents, and two concrete piers.
The monitors are placed on the side of the bridge closest to the contractor’s activities, with geophones anchored directly onto concrete elements or clamped onto steel elements.
The vibration monitors operate continuously, obtaining 1024 samples per second, but storing only peak values for each 5-minute interval. If alert thresholds are exceeded, the monitors record a 10-second wave form and initiate an immediate upload to the project website that sends out email or text message alerts. Waveform reports allow exceedance events to be further analyzed with FFT frequency domain reports.
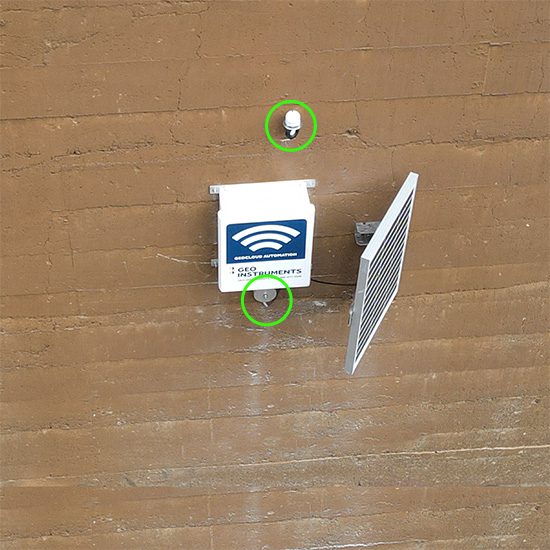
The photo shows one of the solar-powered vibration monitors with geophone and also a co-located prism and tiltmeter.

Monitoring Tilt
Potential rotation is monitored by eight wireless tiltmeters, two on each of the two steel bents, one on each of the concrete piers, and one on each of the steel supports founded on the concrete piers. The wireless tiltmeters report measurements hourly and are co-located with the L-Bar prisms.
Project Website & Data Presentation
The GeoCloud project website automates processing of measurements, standardizes presentation, and provides timely access to data. Plan views, plots and reports are preconfigured to ensure consistent scales, terminology, and sensor selection. Values are updated automatically when new measurements arrive.
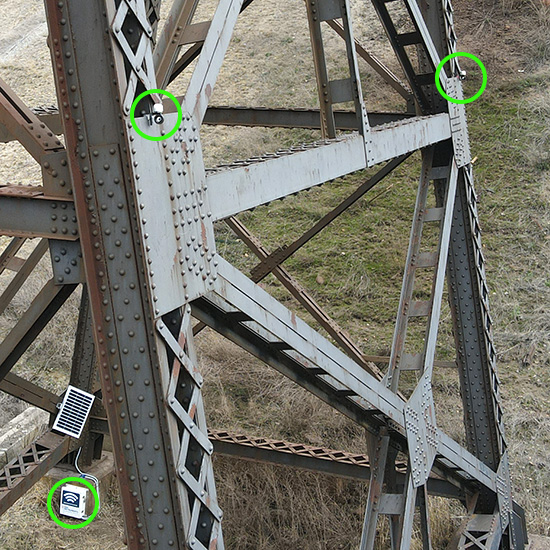
The photo shows two tiltmeters (co-located with prisms). A vibration monitor can be seen at the bottom left.
Baselines and Thresholds
The AMTS system obtained a week of data for baseline measurements. Threshold levels for settlement alerts were set at 0.25 inches. Threshold levels for suspension of work and corrective action were set at 0.5 inches.
The vibration monitors obtained a week of data for baseline measurements of the geophones, which were installed directly onto the structural elements. This allows structural responses to construction activities to be compared to responses to normal rail traffic. Vibration alert thresholds are set according to the type of structure, its age, and its condition.
Tiltmeters also collected a week of data for baseline measurements.
