The Project
An industrial structure will be sited on land that was previously used for farming. The soft ground is undergoing consolidation with wickdrains and a surcharge to improve its bearing strength and stability.
Monitoring Requirements
The progress of consolidation will be monitored using settlement plates. Specifications require weekly surveys as the fill is being placed, followed by bi-weekly surveys for six months afterwards.
Implementation
Settlement plates are often monitored by manual optical surveys, but GEO suggested that automated monitoring with Locator One GNSS sensors would be safer and more efficient.
Locator One sensors can be installed quickly and are fully autonomous. No cables, power supplies, gateways, or maintenance are needed. Automation also eliminates disruptions caused by survey crews traversing the site.
The open sky of the farm field would be ideal for acquisition of GNSS satellite signals. A unique feature of the Locator One is its built-in radar sensor that can report fill height as referenced to the sensor.
Each sensor uploads its measurements by cell connection up to 12 times per day. A GeoCloud project website then presents the settlement data in planviews and graphs.
Locator One Sensors
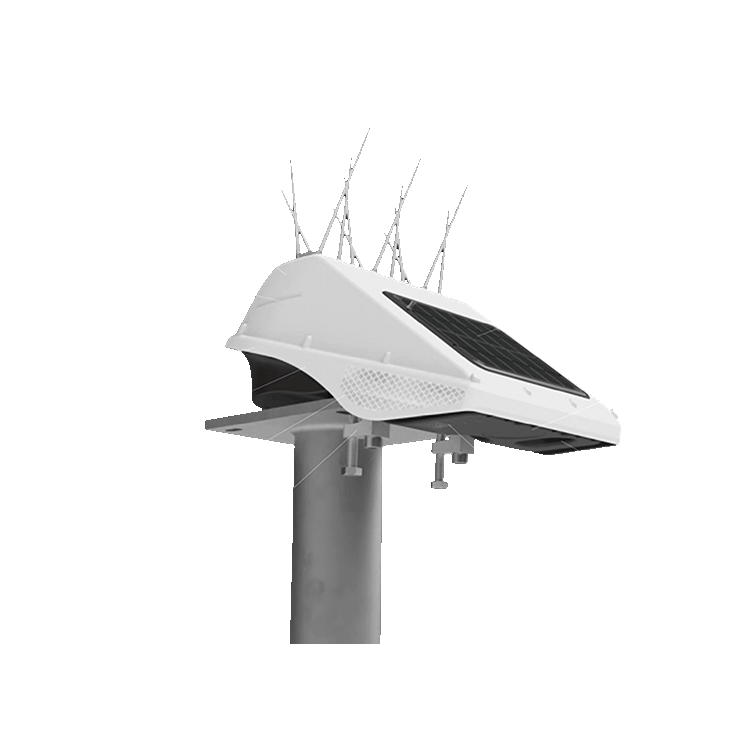
Locator One sensors collect signals from GNSS satellites to monitor displacements in three dimensions.
The processed signals provide an averaged measurement precision of ±2mm horizontal and ±4 mm vertical. The precision is not affected by fog, rain, snow, or temperature.
More about Locator One sensors
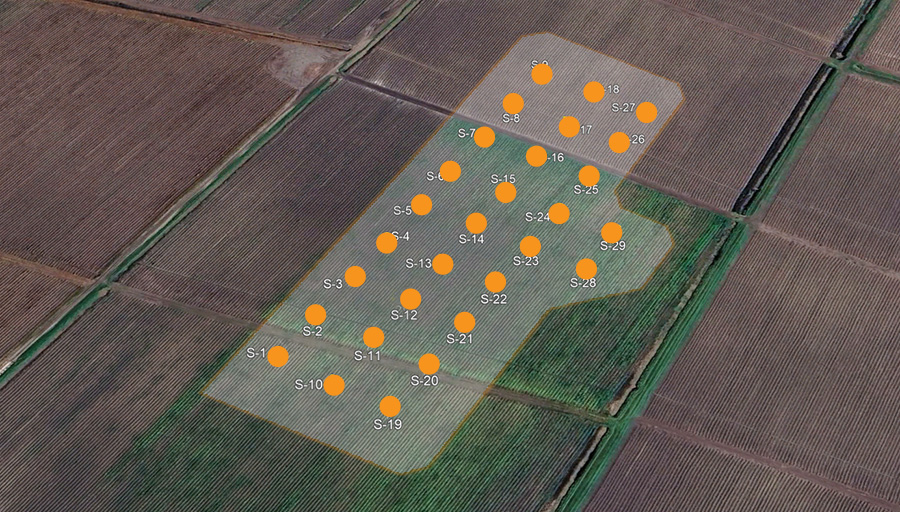
A satellite view of the site with an overlay that shows the planned locations for the settlement plates.
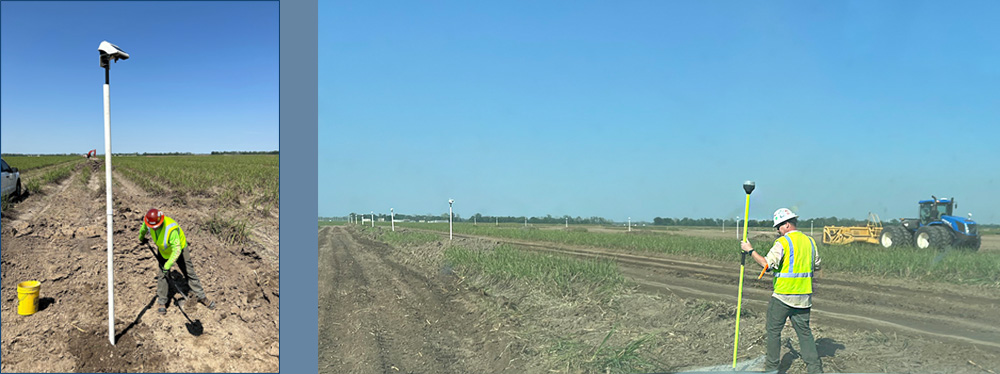
GNSS sensors are attached to settlement plate risers during installation, and precise coordinates for each plate can be established using an RTK receiver.
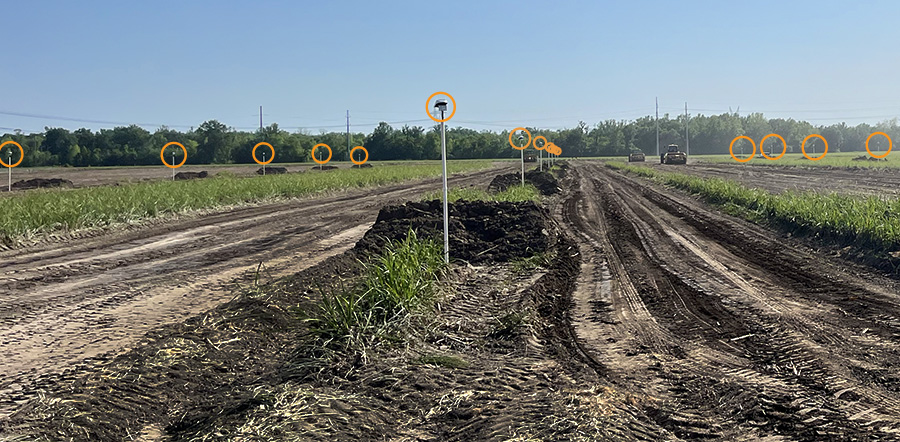
This view shows some of the 30 GNSS sensors deployed at the site. Each sensor independently uploads its measurements to the Cloud up to 12 times per day.
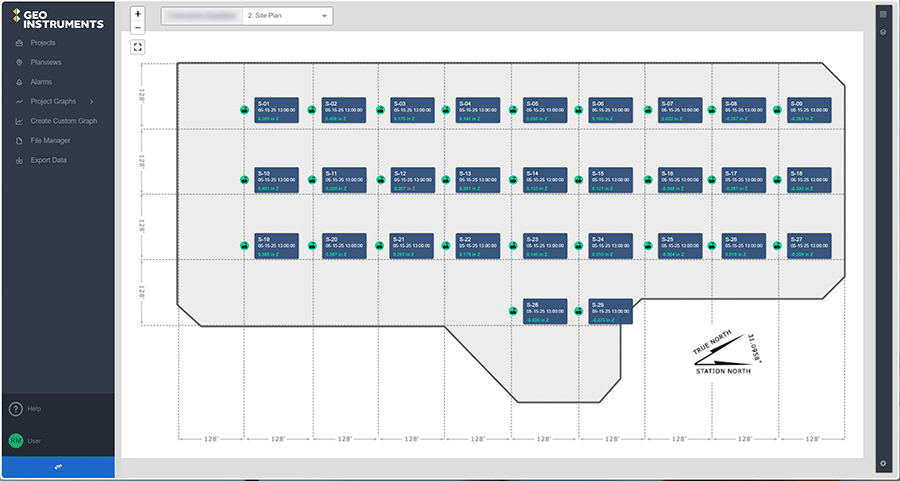
This planview from the GeoCloud Apollo website shows the surcharged area with an overlay of sensors. The label for each sensor shows the current X, Y, Z displacement values. Clicking on a value generates a trend plot.
